Highway safety is the one part of road engineering with a national scoreboard, and the scoreboard is the source of most of the confusion. The Fatality Analysis Reporting System publishes counts to the individual death, by state, by month, by vehicle body class. That precision invites readers to treat the numbers as settled, and the numbers are the most revisable figures in American transportation. Two NHTSA publications six months apart give 2023 death tolls of 40,901 and 41,025, and the agency documents exactly why in the back matter of the first one.
This section works the subject from the measurement outward. If the count is unstable, every before-and-after study built on it inherits that instability, and every countermeasure percentage quoted in a project justification is a claim about a moving baseline.
The measurement problem comes first
U.S. roadway fatalities sets out the two tests a death has to pass to enter the record, the thirty-day survival rule and the public trafficway rule, and the real deaths each one leaves out. It then puts two published rates side by side for 2020, when deaths rose 7.3 percent while travel fell 11.0 percent. Normalise by mileage and the year looks like a collapse in per-mile safety. Normalise by population and it looks like a bad year. Both figures sit in the same NHTSA table, computed from the same deaths, and the choice between them usually decides an argument before the argument starts.
The longer trend inside that data matters more than the annual movement. In 1996, 80 percent of those killed were inside a vehicle. By 2024 that share was 62 percent. Crashworthiness protects occupants. The people it does not reach are protected by geometry or not at all.
Geometry is the lever, and it is expensive
Two articles here deal with geometry, from opposite directions.
Roundabouts and signalized intersections traces the case for roundabouts back to its mechanism, which is the removal of crossing conflicts: 32 vehicle conflict points at a four-leg intersection reduced to 8, with the right-angle and head-on configurations eliminated rather than merely discouraged. It also reports what the underlying evidence could and could not support. In the American sample FHWA published, one number in the underlying table survived a significance test in 2000, and the agency warned that the study sites were chosen because they were already problem intersections. The article follows the benefit by mode, where injury crash reductions ran 95 percent for car occupants and 30 percent for cyclists, and ends on the group whose exposure has never been measured at all.
Guardrails and barriers starts from an admission in Washington State’s design manual: a rail is itself something a vehicle can hit, so putting one in can raise the crash count while lowering the severity. Shielding is the fourth of five options in the roadside hierarchy, behind removing, relocating and redesigning the hazard. The article works through what a clear-zone table actually asks for, from 10 feet at 35 mph to 54 feet on a high-volume 70 mph fill slope, and through the reason the crash-test standard changed: the vehicle fleet outgrew the protocol written in the 1990s. It closes on a detail that surprises most people who have not worked on a paving contract, which is that a resurfacing overlay can push a guardrail below its minimum height without anyone touching the guardrail.
Where the exposure is concentrated
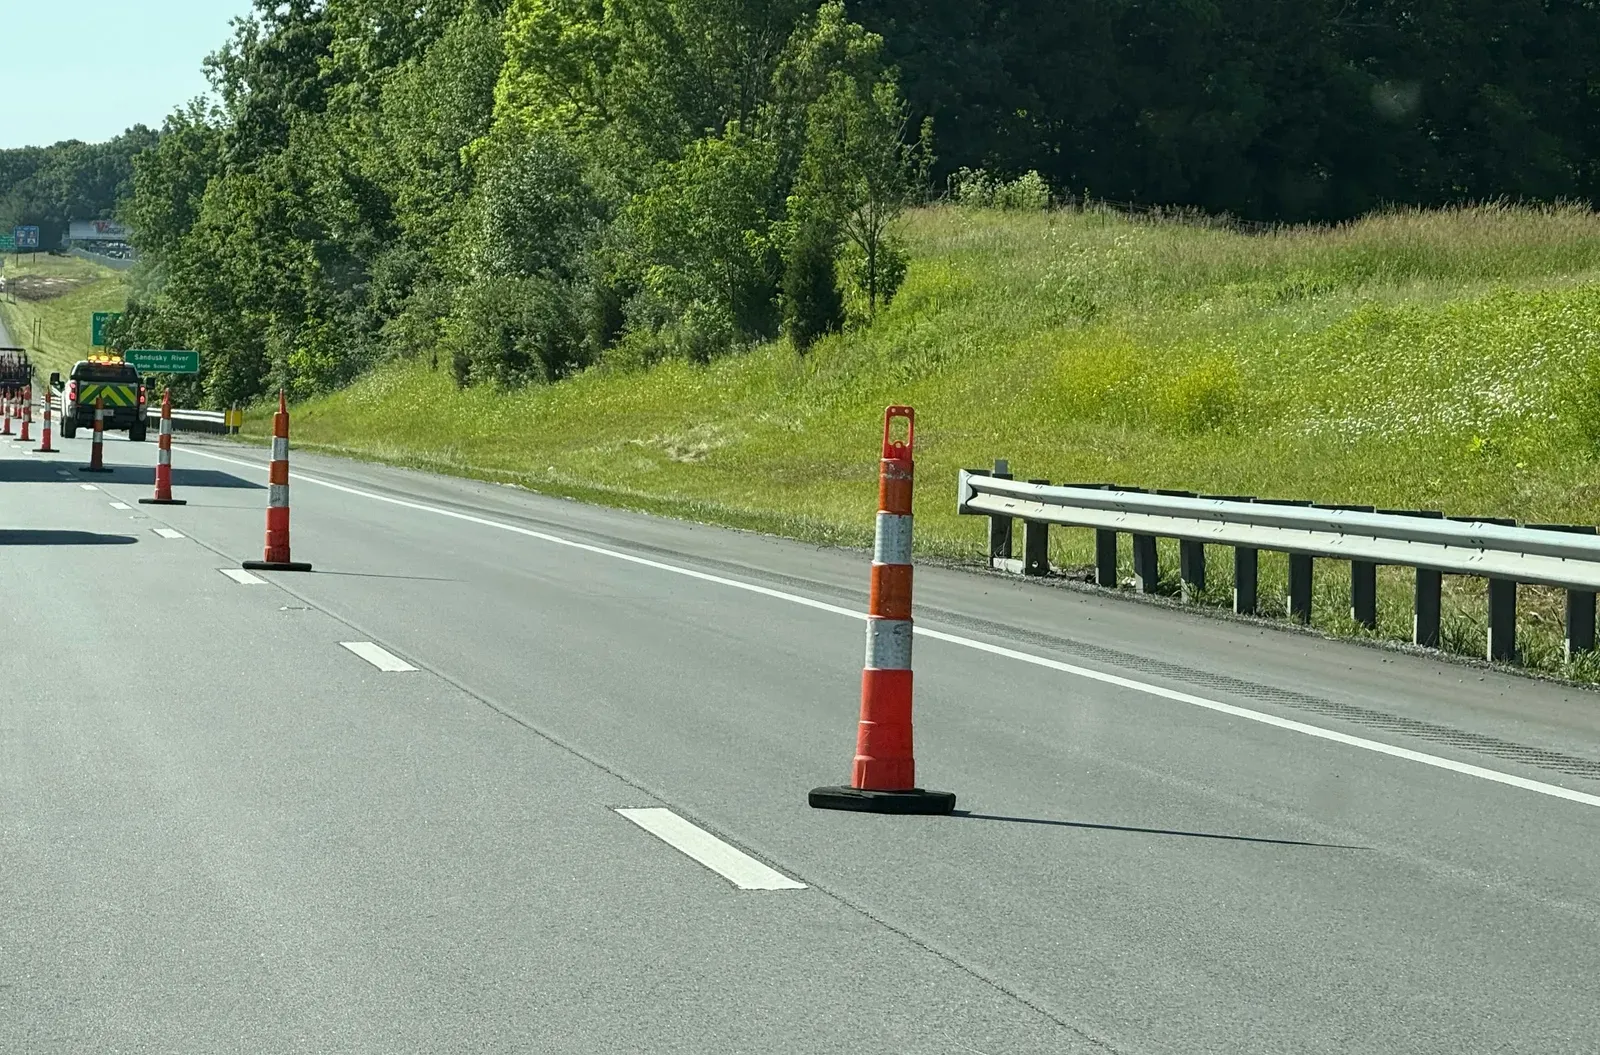
Work-zone crashes begins with the admission in FHWA’s own source notes that no national metric exists for the number of work zones or the vehicle-miles of exposure to them. Outcomes are counted against a denominator that has to be improvised. The article covers what the positive protection rule in 23 CFR 630 requires, why its definition still cites a crash-test standard that has been superseded, and what New York State’s speed camera program has demonstrated in its first full year, including the 139 mph reading and a cumulative net cost of $2.4 million across 2021 to 2023. The most striking figure in it is the simplest: of 891 work-zone deaths in 2022, 94 were highway workers.
Commercial truck safety reads the heavy-vehicle regulatory record rather than summarising advocacy about it. The 2022 rear underride standard, the denied petitions that followed, the 2026 removal of the guard certification label, the nine-year speed limiter proposal withdrawn in July 2025, and the 2009 braking rule that shortened tractor stopping distance by 30 percent with almost no public argument. Alongside those it prices the physical treatments: a climbing lane worked example that runs 4,800 feet of pavement to recover 25 mph of truck performance, and a national truck parking inventory of 308,920 spaces against a shortage 72 percent of state transportation departments reported.
What is unresolved
Three gaps recur across these articles and none is rhetorical. Nobody has published a defensible causal account of the 2021 fatality peak. Nobody has measured crash exposure for blind and low-vision pedestrians at roundabouts, because crash records do not code disability. And nobody counts the safety benefit of a pavement that does not need rebuilding, because the work zones it prevents were never in a denominator. Each of those absences currently reads as an absence of effect, which is the most expensive kind of measurement error a public program can make.